
RWA Tokens & Market
Why RWA Market Size Estimates Range From $2B to $400B
The RWA market is worth $40 billion, or $300 billion, or $2 billion, depending entirely on what the person quoting the figure decided to count. The four definitional choices that move the number most, and how to extract something useful.
RWA market-size figures are not wrong so much as underspecified. Four definitional choices sit behind every headline number, each of them defensible, and together they swing the result by more than an order of magnitude.
This matters beyond pedantry, because these numbers are routinely used to justify decisions. "The market grew 600% this year" reads as an opportunity. Usually it is a statement about institutional treasury operations you cannot participate in, or about a base so small that the percentage is meaningless.
Here is how to take the numbers apart.
Choice 1: Do stablecoins count?
The single largest swing factor, and it is almost never stated.
Stablecoins are, strictly, tokenised real-world assets. USDC is a claim on dollars and short-term instruments held in reserve. By any structural definition it belongs in the category.
Most RWA trackers exclude them anyway, on the reasonable grounds that stablecoins are their own established category with their own dynamics, and including them would swamp everything else.
But the choice is enormous. Stablecoins represent hundreds of billions of dollars. Everything else in RWA — treasuries, gold, equities, credit — is a small fraction of that. A report including stablecoins and one excluding them are describing different universes, and both will call the result "the RWA market."
Before comparing two figures, establish whether both made the same choice here. If you cannot determine it, the comparison is not meaningful.
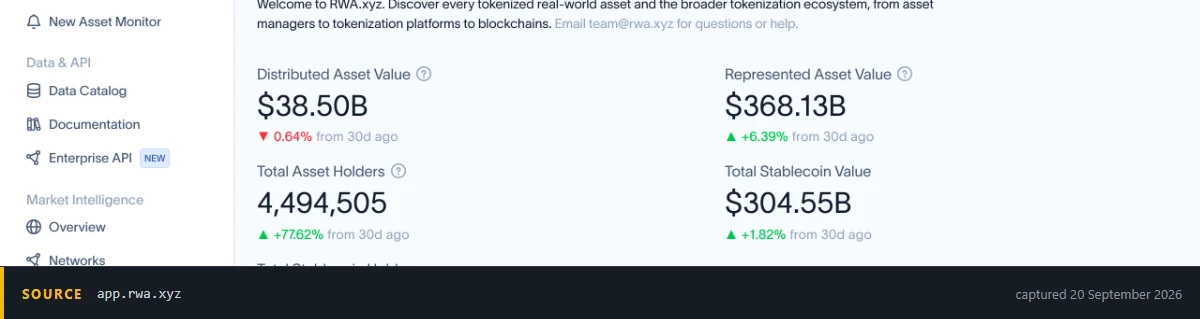
Four headline numbers on one dashboard, and the two largest differ by about a factor of ten. The stablecoin total is kept on its own line, which is exactly the decision that makes two market-size figures impossible to compare.
Choice 2: TVL, market cap, or cumulative volume?
Three very different quantities, routinely presented side by side as if interchangeable.
- Total value locked / assets under management. What is held in the product right now. The most meaningful figure for asset-backed products, and the right default.
- Market capitalisation. Token price times supply. For an asset token this roughly equals TVL. For a sector token like ONDO it is something else entirely: a market's opinion about a governance token, which as sector tokens explains may have no mechanical connection to the underlying business at all. Adding a sector token's market cap to asset TVL produces a number that means nothing.
- Cumulative trading volume. Everything that ever traded, added up. This is the number to be most careful with, because it is the largest and the most quotable.
A concrete illustration: xStocks recorded cumulative volume exceeding $25 billion within roughly eight months of launch, while holding around $600 million in assets. Both figures are accurate. They differ by a factor of about forty, because volume counts the same dollar every time it changes hands. High volume relative to holdings means active trading, which is useful to know; it is not a measure of size.
Rule: if a figure seems surprisingly large, check whether it is cumulative volume. It usually is.
Choice 3: How is multi-chain deployment counted?
Many RWA products exist on several chains. Ondo's tokenised equities span Solana, Ethereum and BNB Chain. Gold tokens deploy across multiple networks.
If a tracker sums per-chain figures without deduplicating bridged supply, the same asset gets counted more than once. Good data sources handle this carefully. Aggregators assembling numbers from chain explorers often do not.
This is a smaller distortion than the first two, but it inflates consistently in one direction, and it is worst exactly where growth looks most exciting, newly multi-chain products.
Choice 4: Is the product one you could actually buy?
The choice with the most practical consequence for a reader, and the one no tracker makes for you.
A large share of the tokenised treasury market sits in products requiring qualified purchaser status — $5 million in investments — as covered here. BUIDL, OUSG, USYC, USTB and Maple Cash are all in this category. They appear in every market-size chart. Retail cannot hold any of them.
So when tokenised treasuries hit a headline milestone, the correct reading is: institutional adoption of on-chain settlement is growing. That is a real and significant fact about the industry's direction. It is not a description of an opportunity set available to you.
Mentally split every RWA figure into two buckets; institutional-only and retail-accessible. The second bucket is much smaller and much more relevant to your decisions.
A worked example
Take the August 2026 tokenised equity figures and see how much is extractable.
The reported facts: tokenised single-name stocks reached about $2 billion, nearly 5% of the total RWA market. Ondo held roughly $957 million, bStocks $622 million, xStocks $600 million, together about 77% of the segment. Separately, BNB Chain went from roughly 45,000 RWA holders in April to over 1.3 million by early September.
What can we legitimately conclude?
The RWA market excluding stablecoins is roughly $40 billion — If $2 billion is about 5% of the total, the total is around $40 billion. Useful, and note that it is far smaller than most coverage implies.
Tokenised equities are a small slice of RWA, but the retail-facing slice — Nearly 5% of the market — yet it draws the most retail attention, because most of the other 95% is institutional treasury products.
The segment is extremely concentrated — Three issuers hold 77%. For a reader, this is the most actionable item on the list: your practical choice set is essentially three products, and choosing between their legal structures is most of the decision.
Holder growth is real and small-ticket — 45,000 to 1.3 million holders is roughly 29x. But note what is being measured: holders, not assets. Cross-referenced with segment AUM, average position sizes are clearly modest. This is genuine retail adoption in small amounts — a healthier signal than the same growth from a handful of whales, and not evidence of large capital movement.
What we cannot conclude: that these growth rates continue; that market share is stable (it moves fast in a young market); that any of this says anything about the quality of the products.
That last point deserves a moment. Market share is not a safety rating. xStocks has enormous distribution and the weakest legal claim of the three, an unsecured tracker certificate. Size and structure are independent variables, and conflating them is exactly the error these numbers invite.
The five questions
For any RWA figure you encounter:
- Does this include stablecoins? Order-of-magnitude effect.
- Is this TVL, market cap, or cumulative volume? Up to 40x effect.
- Is multi-chain supply deduplicated? Inflationary if not.
- What share is in products I could actually buy? Often most of it is not.
- What is the base for any growth rate? 600% growth from a small base is a different statement than 600% from a large one.
If a source does not let you answer these, it is not a source you should be reasoning from.
Where to check, rather than trusting an aggregator. Three trackers publish methodology alongside their figures, which is the whole point: RWA.xyz (asset-level breakdowns by category and issuer), DefiLlama's RWA section (TVL on a consistent, cross-chain-deduplicated basis), and Dune (community dashboards where the SQL is visible, so you can see exactly what is being counted). Open the methodology note before quoting the number, and check specifically how each one treats Choice 1; whether stablecoins are in or out. They do not all answer it the same way, which is why their totals differ.
What the numbers are good for
Not selection. No market-size figure tells you whether a product is well-constructed, which is what determines your outcome.
They are good for three things:
Liquidity assessment
Segment and product-level AUM tell you roughly what depth to expect. Thin segments mean wide spreads and difficult exits, directly relevant to the drift problem. And this is the one place where you can replace the headline with a number that is actually about you: https://lite-api.jup.ag/tokens/v2/search?query=TSLAx returns the dollar liquidity pooled behind a specific Solana token, and https://api.kraken.com/0/public/Ticker?pair=PAXGUSD returns the live spread and volume on PAXG, XAUT or ONDO. A segment total tells you nothing about the position you are about to take. Those two do.
Concentration awareness
Knowing three issuers hold 77% of tokenised equities tells you an issuer-specific problem would be a segment-wide event, not an isolated one.
Direction of institutional travel
Growth in institutional products signals where infrastructure is being built, which shapes what becomes available to retail in two or three years.
Those three are worth knowing. None of them is what the headline is inviting you to feel, which is that a large number going up is an opportunity you are missing.
Explanatory, not advice. Market figures cited reflect reporting as of August–September 2026 and move quickly. Always check the methodology behind any figure before relying on it.